A finance workspace for answers you can check
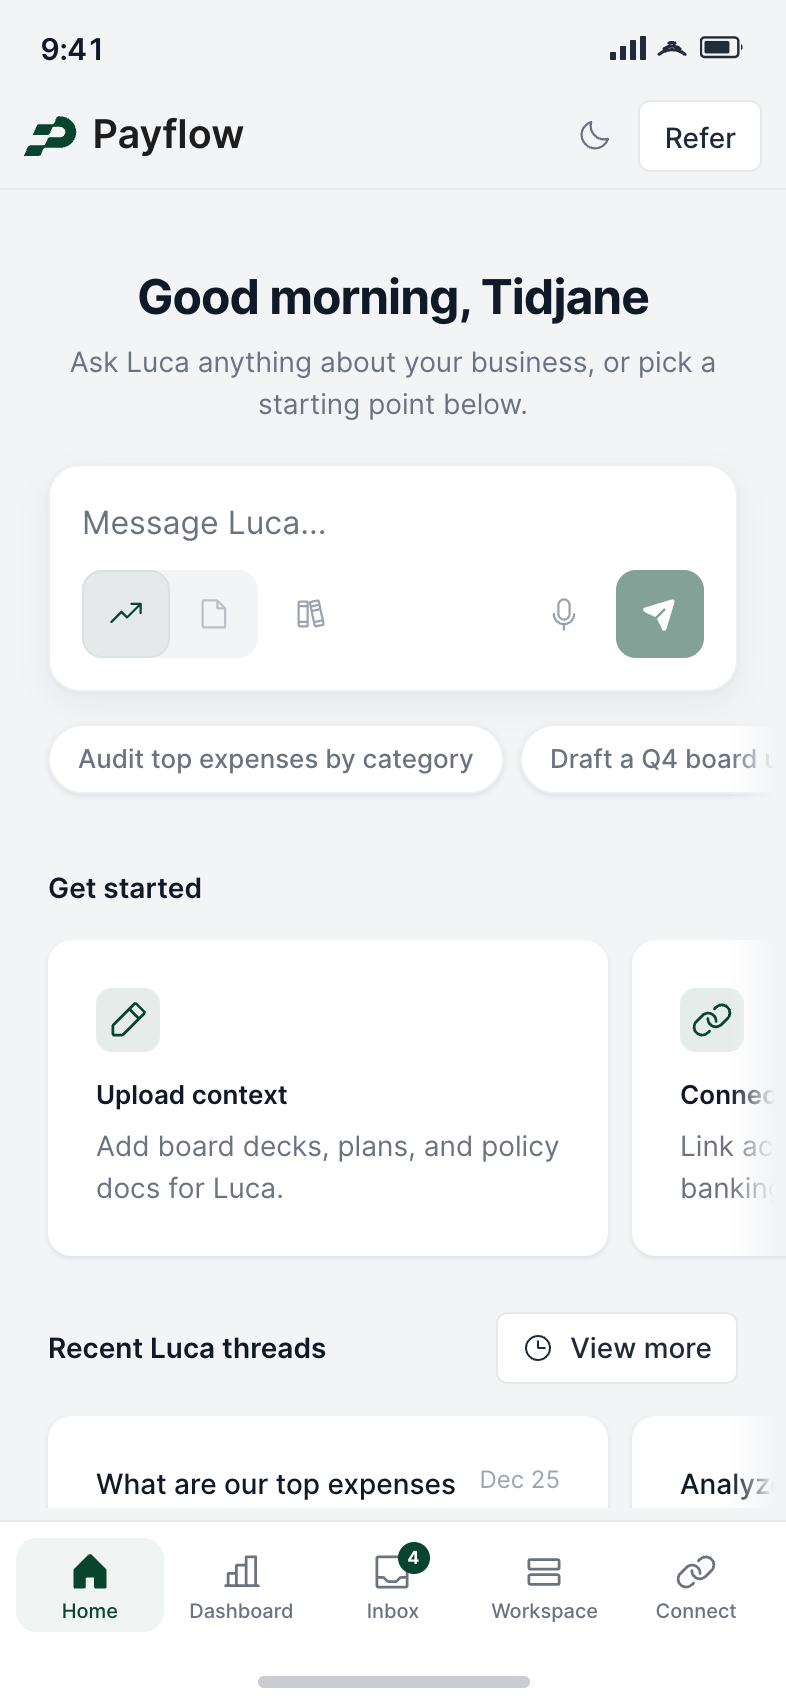
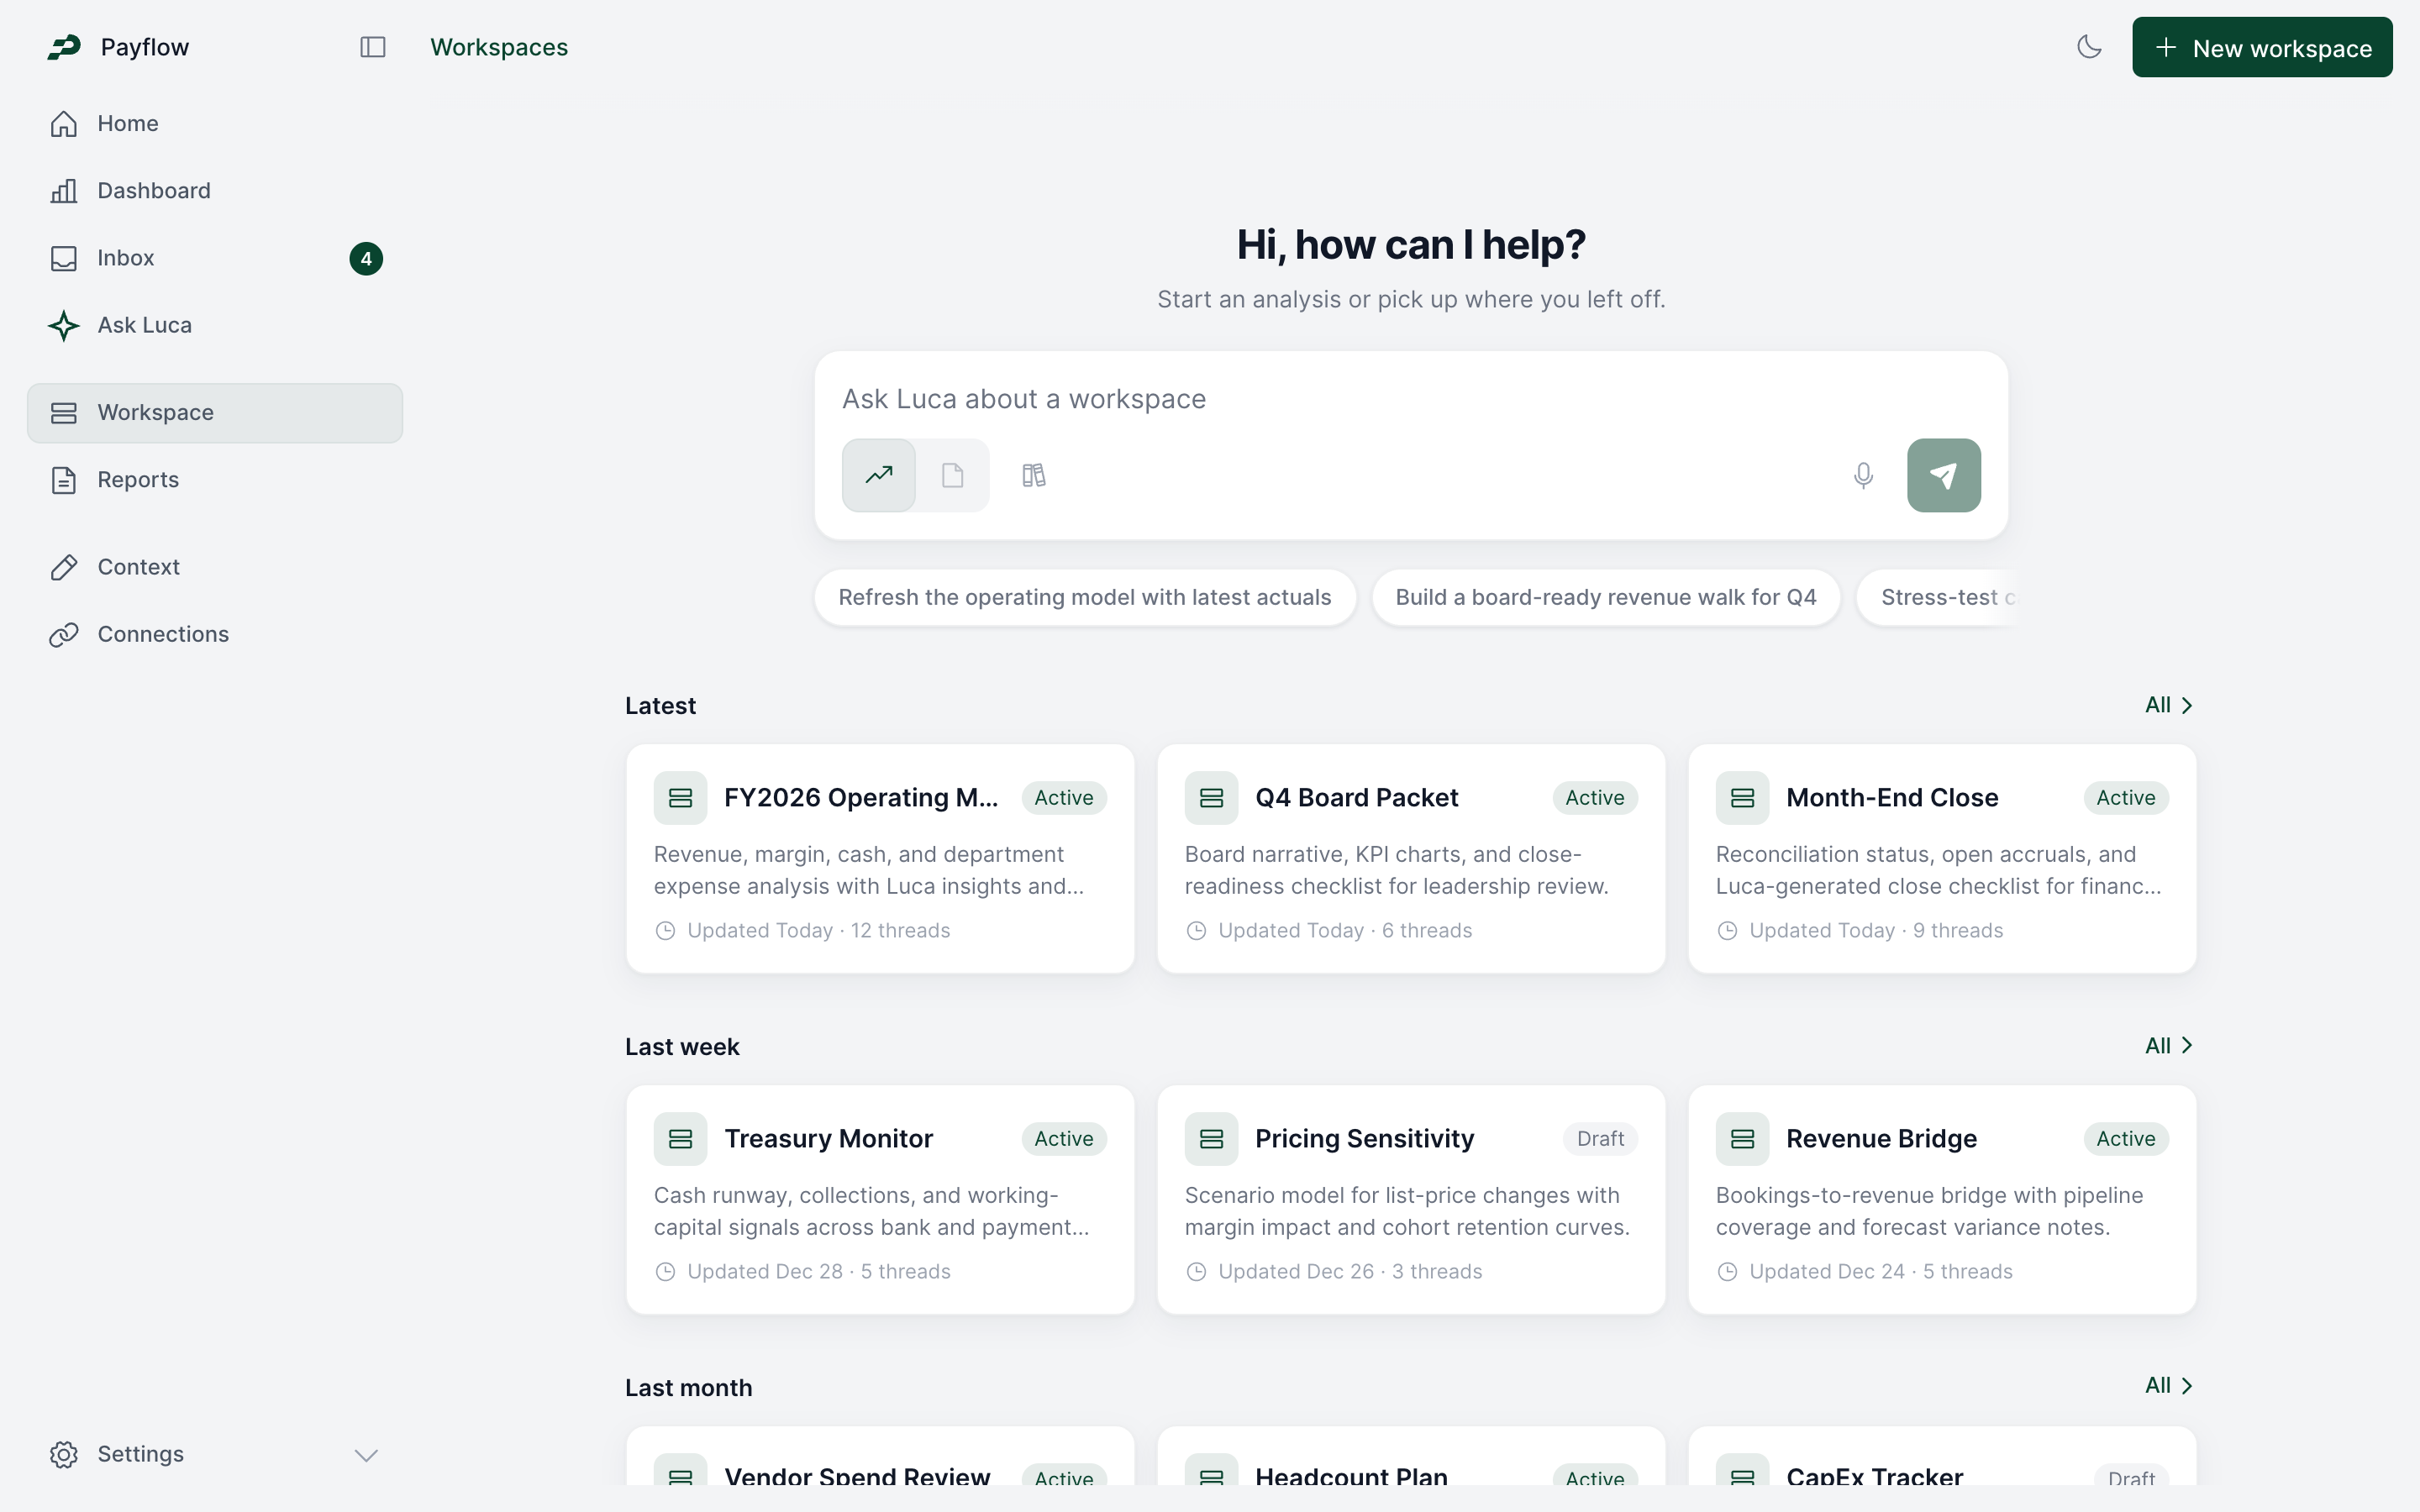
I designed Payflow’s workspace so finance teams could inspect the evidence behind Luca’s answers before taking a recommendation to the board.
- Finance
- Accounting
- AI Workspace
- Design Engineering





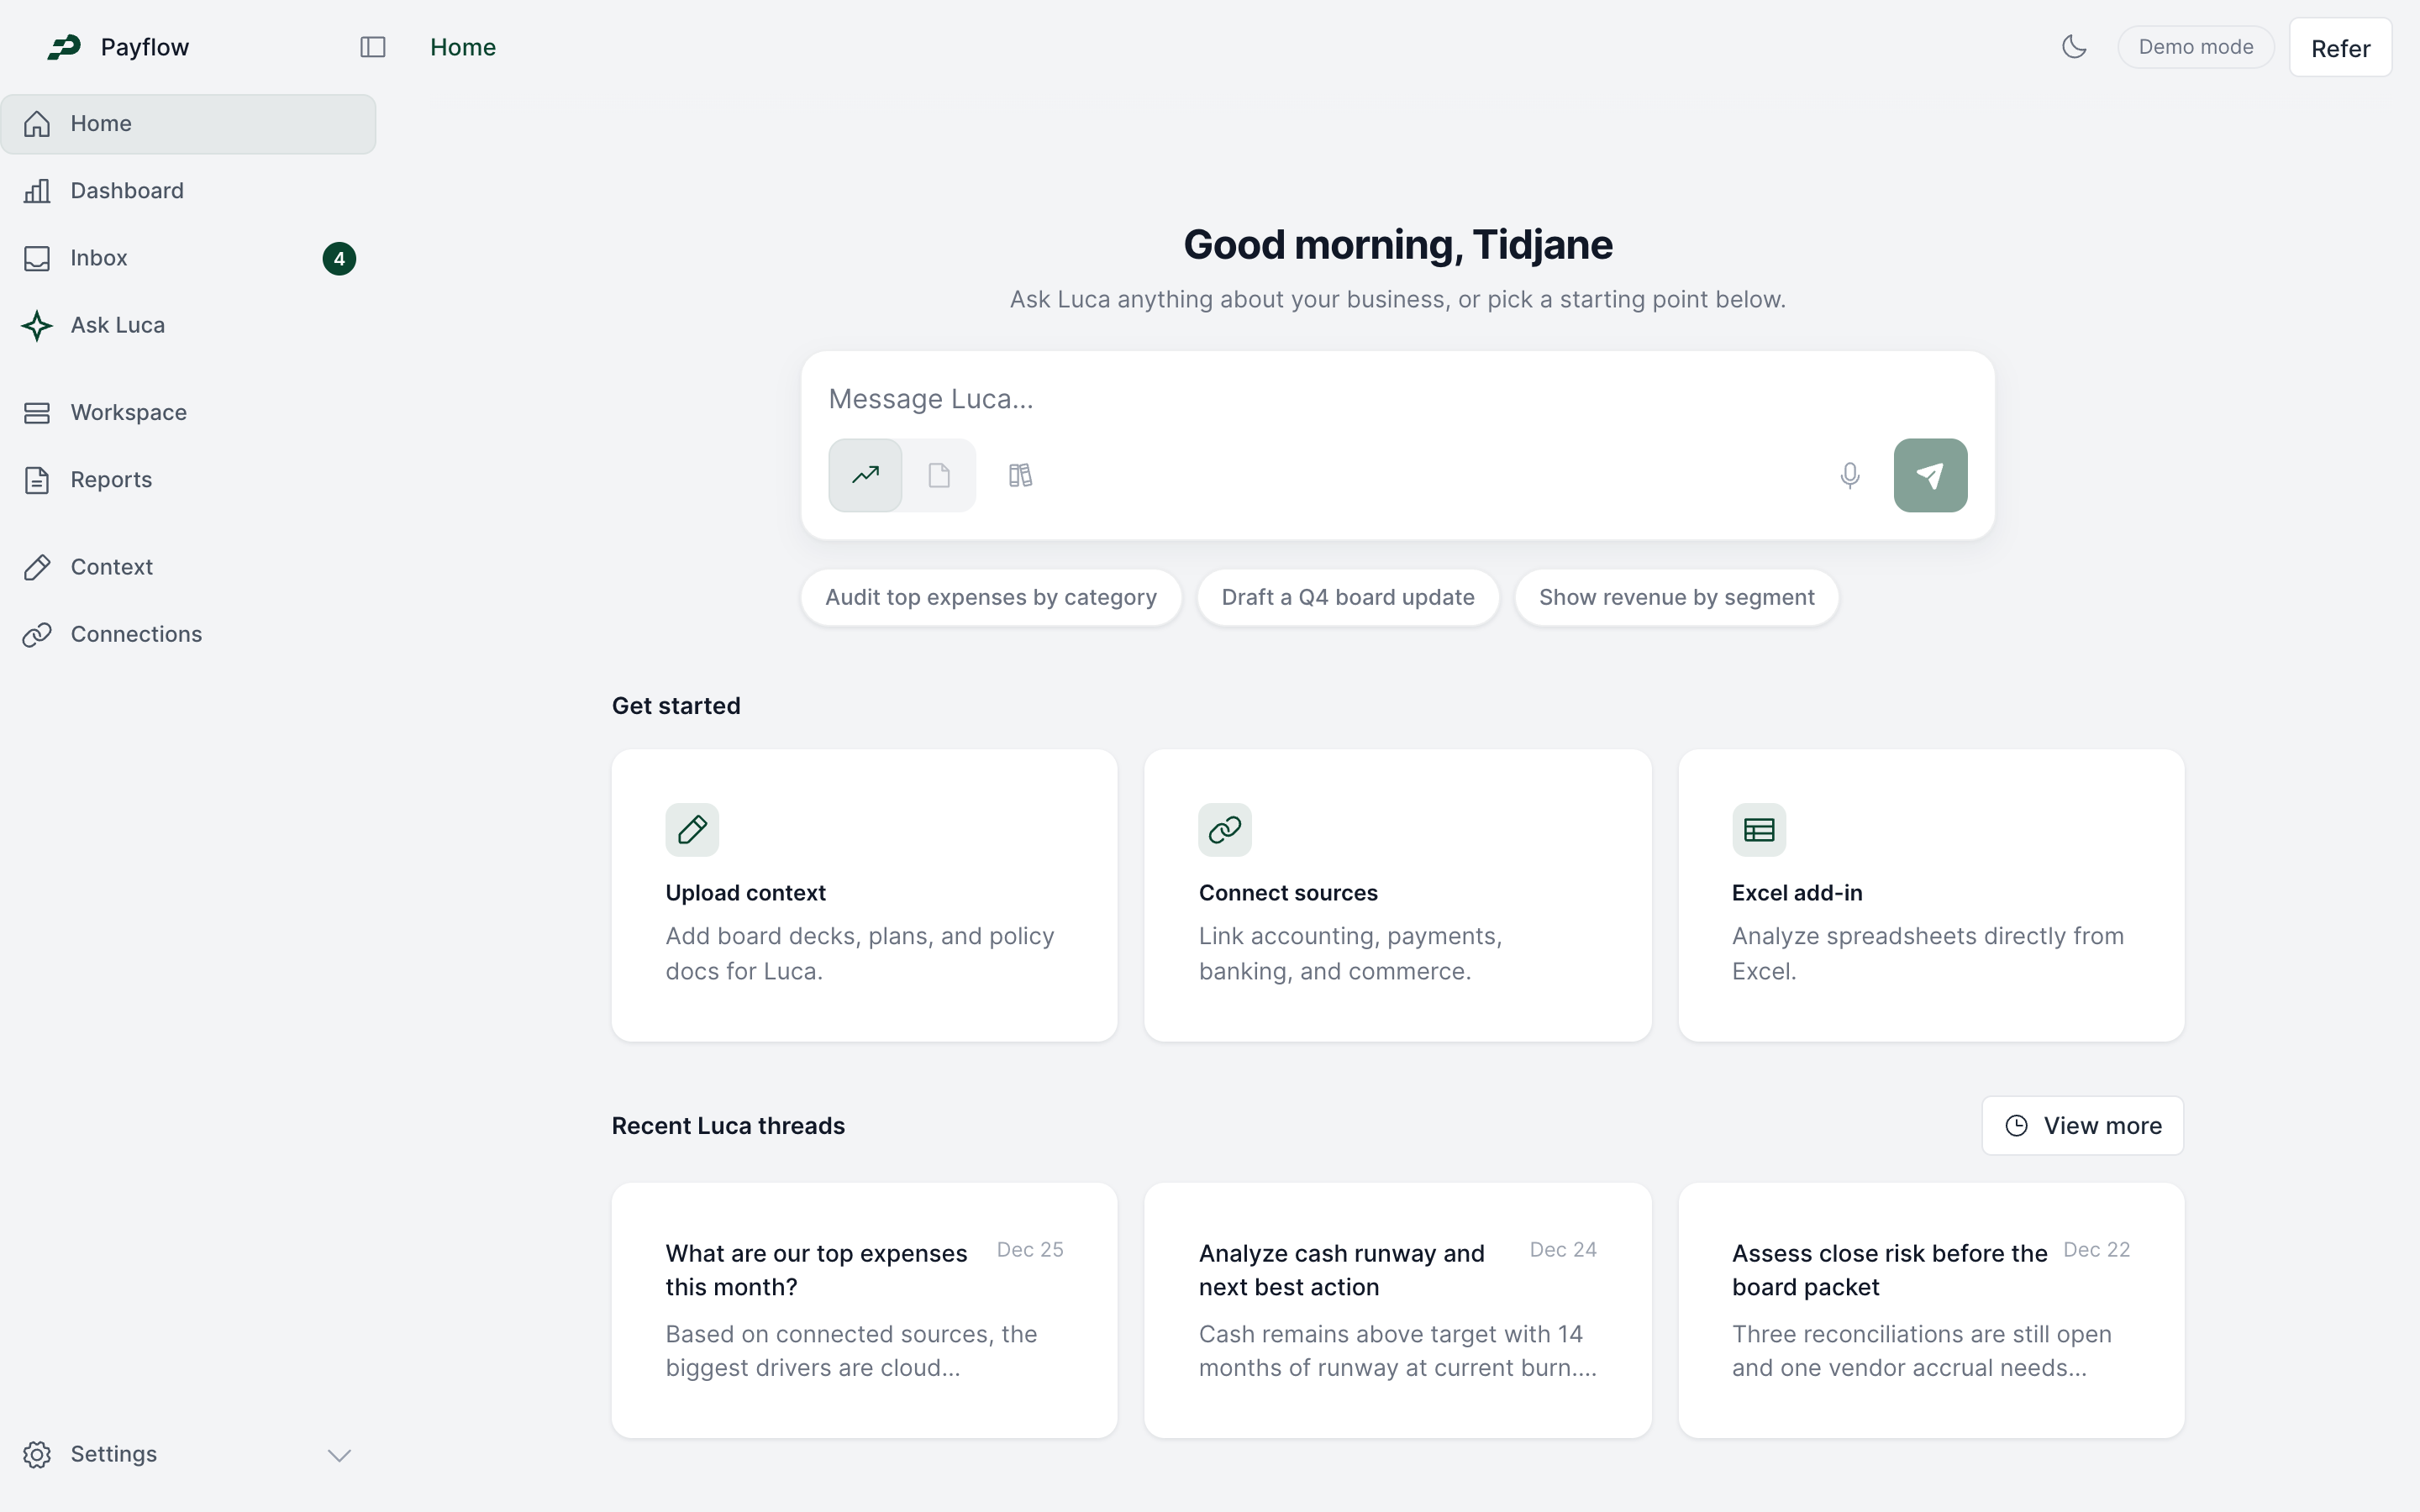
Project overview
Overview
Would you take Luca’s recommendation to the board?
In a Payflow prototype report, Luca recommends shifting 8% to 10% of paid marketing spend into referrals. The CFO needs to know what the $27.42 acquisition figure counts before acting on it.Role
Product designer and design engineer
I designed the workflow from choosing inputs to reviewing a report and built the responsive prototype through Plastive.
Team: Payflow product and engineering
Problem
The source has to travel with the answer
Finance needs to check the source, period and calculation behind a figure. That work gets harder when the answer moves from a chat thread into a board packet.
Solution
Keep the report open to review
I kept the question and report together so an analyst could inspect a chart, see the files in scope and ask a more precise follow-up.
What each finance role needed to verify
| Customer need | Design response |
|---|---|
| FP&A wanted to try questions with known answers, such as vendor spend or invoice counts. | Show which inputs Luca will use before the analyst sends the first question. |
| Finance operators wanted to explore a chart without creating a dashboard. | Build the report alongside chat and let dense tables expand. |
| A CFO wanted executive highlights, detailed tables for finance and a path to the exact ledger entry. | Put the recommendation first and make the route to the underlying data clear. |
A connected account and a file belong at different moments

Budget versus actuals · Early wireframe
Show the two workbooks before send
In June, the team asked where search would fit after an @mention. I kept selected files visible in the composer so the analyst could correct the inputs before sending.
Prototype · Connections
Confirm whether data has synced
Connection status belongs at the account level. The report still needs to identify the records it used.

Prototype · Context
Add the file when the work calls for it
A finance operator can keep a budget or policy file available and choose it for the relevant analysis.
The report needs to survive the next question

Budget versus actuals · Report canvas
Keep the question and the report visible
The split keeps follow-ups anchored to the figure. Expanding the report frees room for wide tables but moves the thread out of sight.
Nine wireframes from first question to report review


Start with a known finance question
Can history open without interrupting the review?
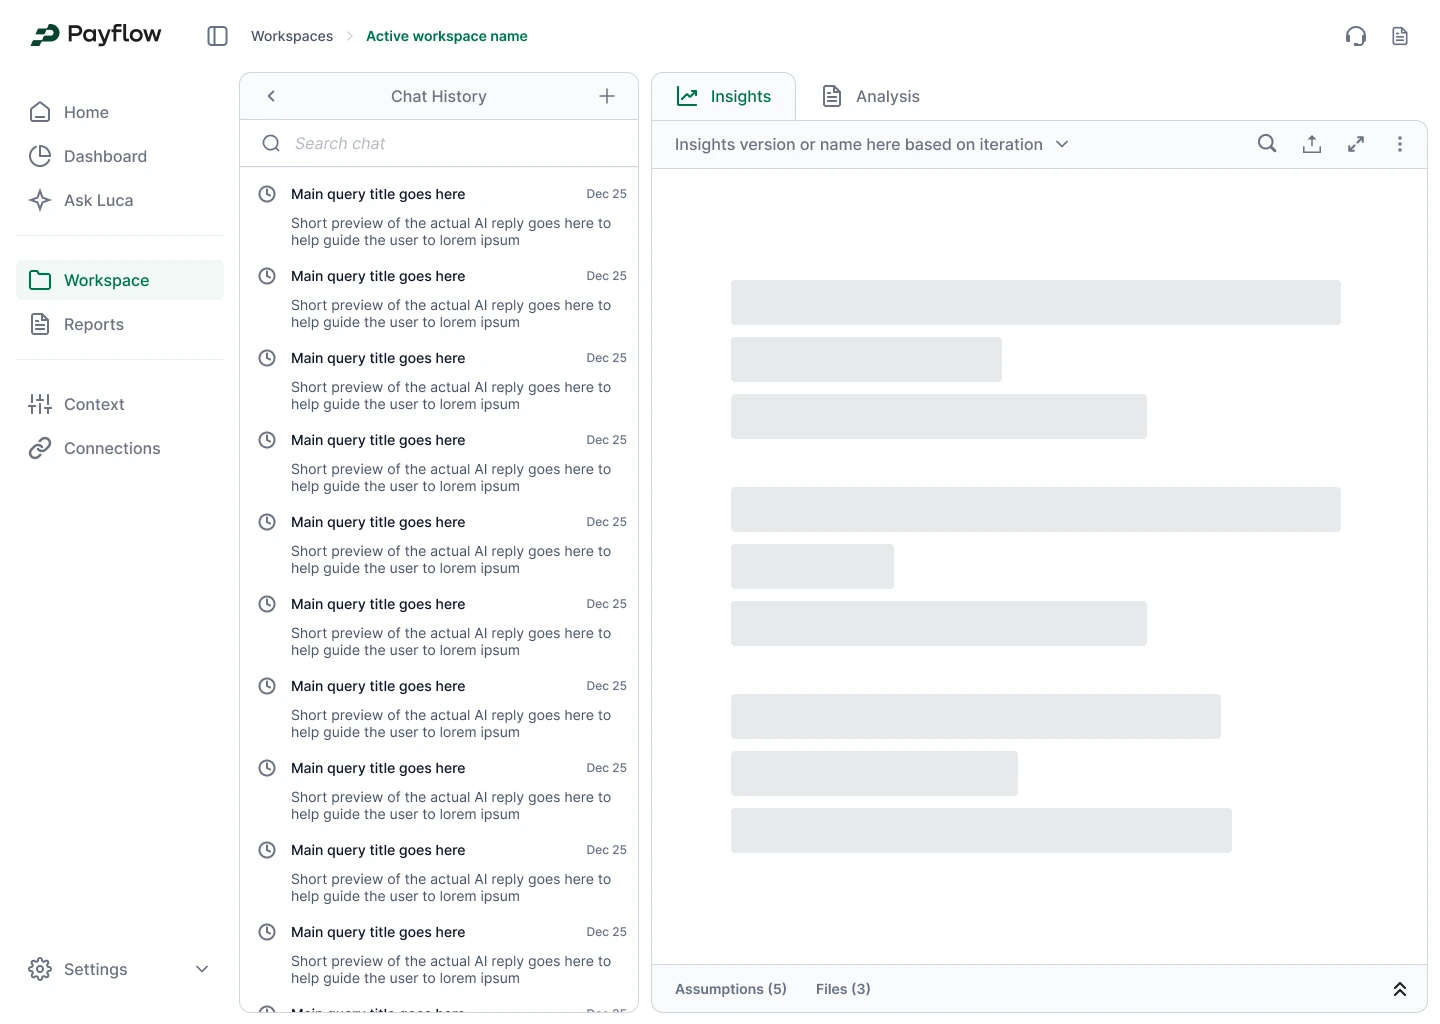
December design exploration
A. Put history in the chat pane
The report stays visible for comparison. Narrow previews truncate and the composer yields its space.
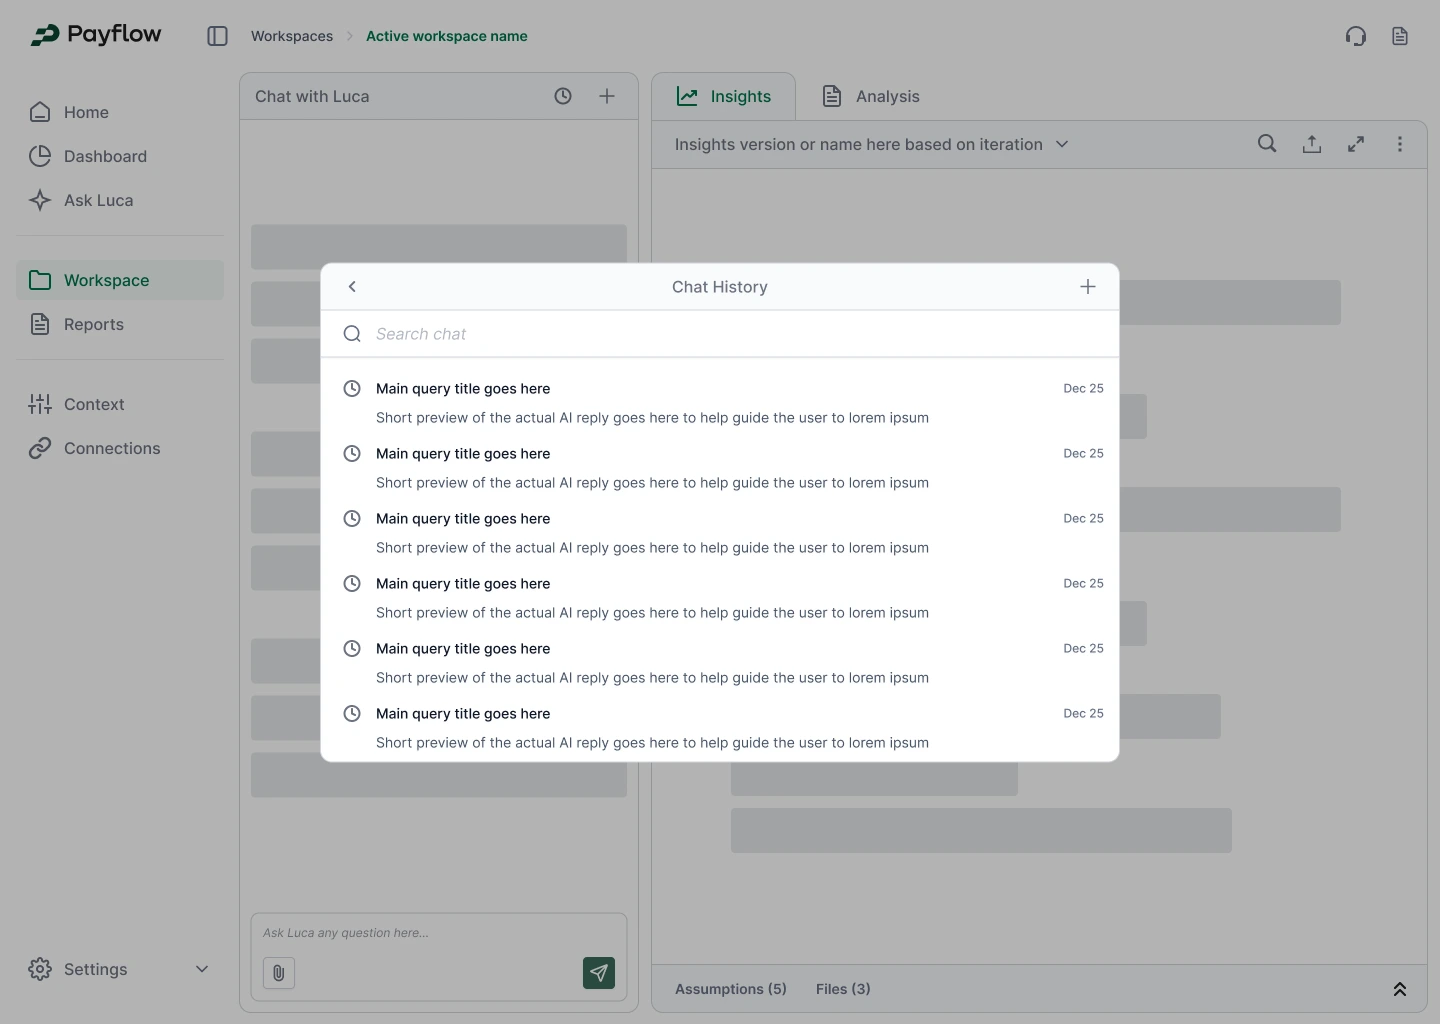
December design exploration
B. Open history in a dialog
Wider previews help distinguish similar questions. The dialog covers the report while the analyst searches.
For active review I’d start with the pane and test whether analysts can find a prior answer without losing track of the current figure. Search already existed. These studies explored where it should live.
A trend and a comparison answer different questions
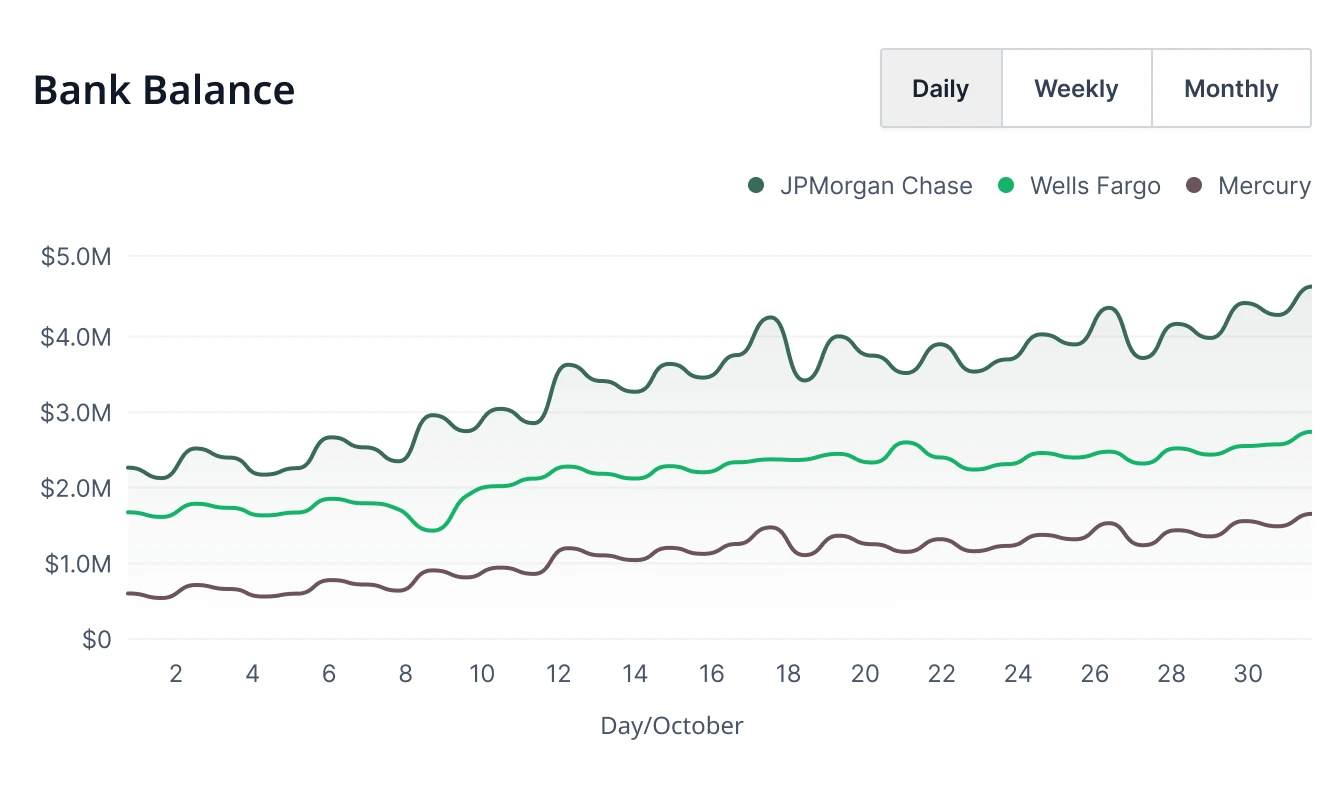
July study · Bank balance trend
When did cash move?
Treasury can spot accounts moving at the same time. The selected interval and exact balances need to be accessible.
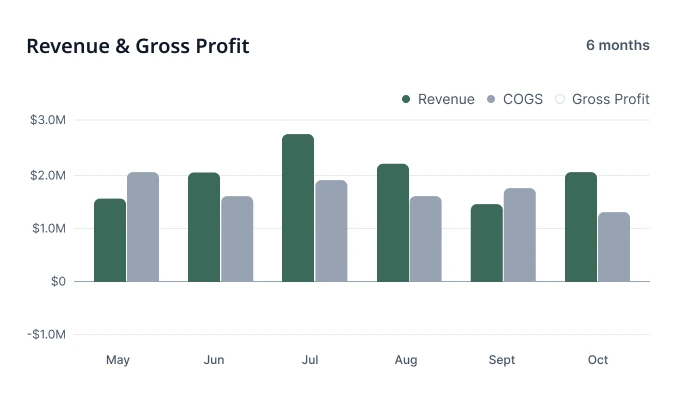
July study · Revenue and cost comparison
Where did revenue and costs diverge?
FP&A can compare the two amounts in the same month. A table supports reconciliation and a point note can explain a material change.
Prototype · Dashboard
Let the reader follow up from the figure
The dashboard gives executives a quick read. Questions attached to a chart let finance investigate without restating which metric they mean.
The reported figure is cost per signup
Prototype · Acquisition report
The prototype exposes the channel data
The reviewer must infer the denominator from the channel breakdown or CSV. The corrected label and review note below make that judgment visible.
Paid search cost per signup
May 2026 · Prototype sample data
Proposed review note
Hold the budget shift
$10,200 ÷ 372 signups = $27.42
The file ends at signup. Ask for paying-customer counts and evidence that added referral spend brings in incremental customers.
Download sample CSVThe December audit showed comments attached to a whole chart. I’d pin a note that disputes one figure to its metric, period and report revision, so the reviewer can tell when refreshed data needs a second look.
Return to the work after the meeting


Start a new question
On a phone, review one task at a time
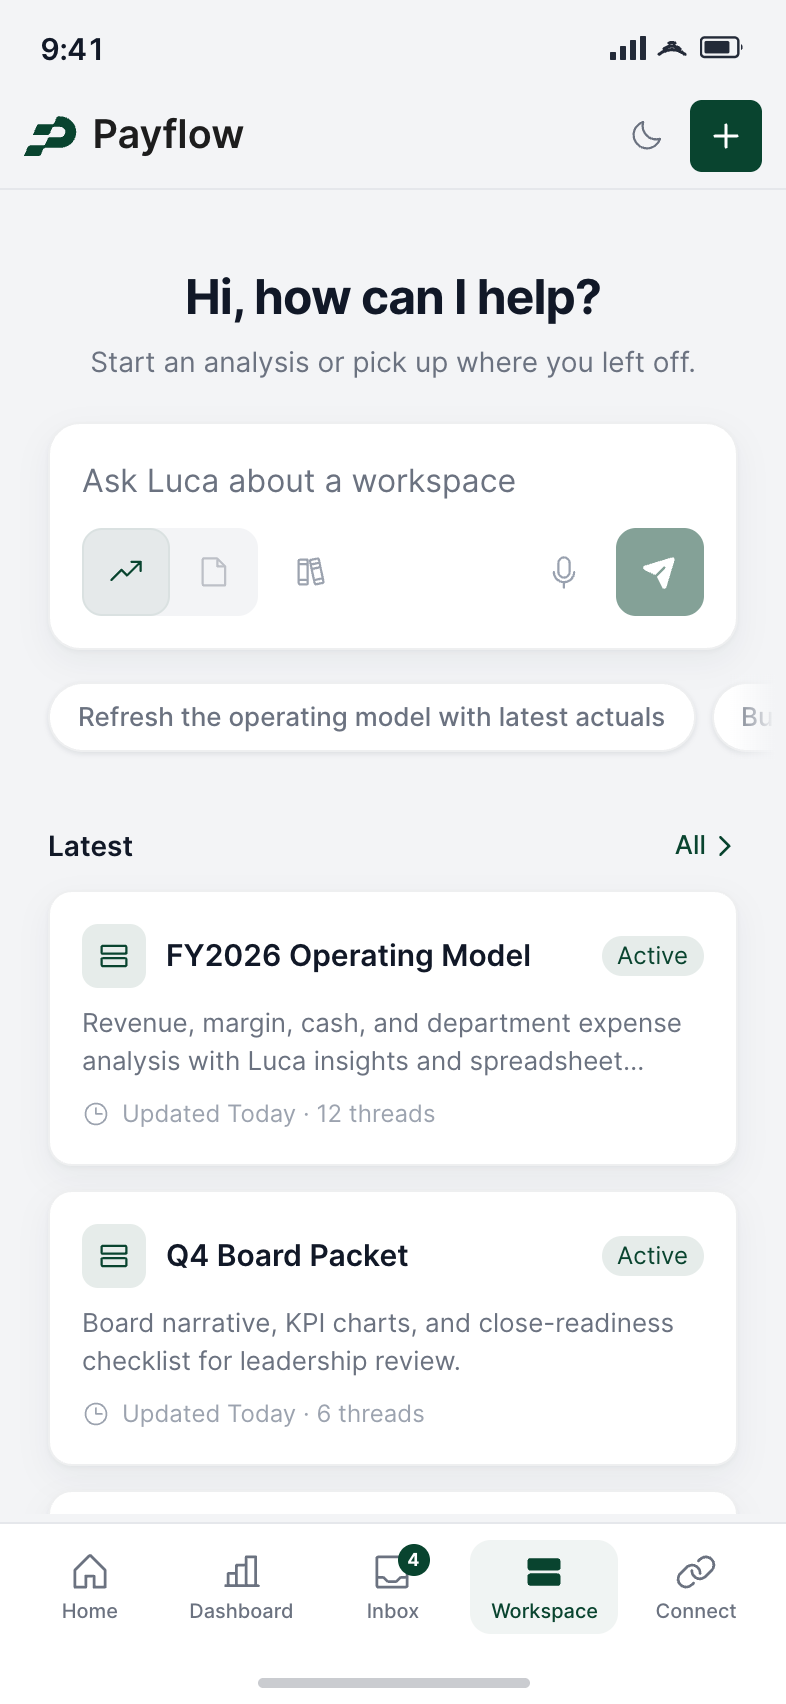


One chart renderer across three product views
- Chart families integrated into main
- 9
- Product views using the renderer
- 3
- Workspace scenarios on the UX branch
- 8
| December 2025 | What changed |
|---|---|
| 18 · UX branch | Storybook covered workspace states including narrow and wide chat. |
| 19 · Client main | The shared chart renderer entered dashboard tiles, expanded charts and Luca Insights. |
| 22 · Starter prompts | The team updated prompt examples to match the supported charts. Regional sales switched from radar to bar. |
What I’d test next. Give analyst and CFO pairs matched packets with a faulty denominator in one. Measure correct accept or hold decisions, time to a verified answer, and whether the reviewer can cite the source.
The interaction patterns behind the prototype
Shipped with
Product design and design engineering
Workspace structure, interactions, chart studies and responsive prototype
Product and engineering
Customer discovery, technical constraints and integration into the client frontend
Finance operators
Workflow context and product feedback
Notes
3 references- NotePayflow product roadmap draft, May 7, 2025, pp. 3–8. April demos and customer meetings.
- NotePayflow design archive. Budget-versus-actuals wireframes, July chart studies and December 9 chat-history mockups.
- NotePayflow client frontend. December 18 UX branch, December 19 chart integration (#1174), and December 22 prompt updates (#1201).